Grouping Data
- When making charts/graphs, you can sort your data via groups – but groups are static and will have to be manually updated if you add more data to your visual (For example, number of people in age ranges). Instead, use calculated columns and reference those as your axis instead. Sample code:
IF([Age]<31, "0-30",
     IF(31<= [Age] && [Age] < 61, "31-60",
          IF(61 <= [Age] && [Age] < 91, "61-90",
               IF(91 <= [Age] && [Age] < 121, "91-120", "Over 120"))))
- Syntax: IF([condition], “[label]”, “[else label]”)
- Above uses nested IF’s
- * Note: Cannot group measures for customized visual display. Grouping this way only works for individual columns, to the extent of my understanding
Custom Sort Axis Labels
- Power BI does not have an easy way to custom sort axis labels either as of the writing of this document. Currently the quick and dirty way around it is to use periods at the beginning of axis titles.
- Example: months of the year
- January, February, March, and April would be auto sorted as April, February, January, March. To solve this, the workaround is to name them as such: “…January”, “..February”, “.March”, “April”
- The cleaner method is to make a new column in your query, and treat it as an index for your axis labels. Continuing with the months example:
- Example: months of the year
1. Top Ribbon > Home > Edit Queries > Select your table/Query on the left
2. Right click on and duplicate your Month column
3. On the duplicated column (By default, “Month – Copy”. I like to rename it as “Month – Index”), right click and choose “Replace Values”
4. Value To Find: January
— Replace With: 1
— OK
5. Repeat with all months, until the “Month – Copy” column contains only numbers 1 – 12.
6. Change data type to Whole Numbers
7. Close & Apply
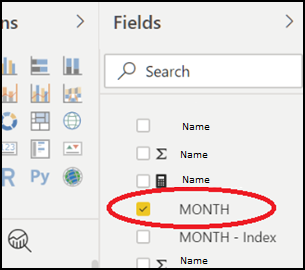
8. Under Fields, go to your table and click on the Month column
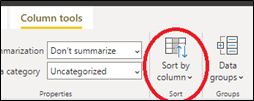
9. Go to Column Tools in the ribbon, then “Sort by Column”
- If the button is greyed out, make sure you’ve clicked on the Month column
10. Select “Month – Index” (your duplicated column).
11. Your visual should now display the months in the correct order, without having to use periods
— Thorough explanation here: https://www.c‑sharpcorner.com/article/sort-by-month-name-in-power-bi/ or archived through the waybackmachine: https://web.archive.org/web/20190723215646/https://www.c‑sharpcorner.com/article/sort-by-month-name-in-power-bi/