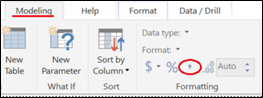
- If your visual does not have commas for 4+ digit numbers (Example, PCN Count)
- Make a new measure: PCN Count = COUNT(PCN)
- Having your new measure selected under Fields on the right, you can click the comma under the Modeling ribbon > Formatting
Show decimals/Changing the number of decimals shown
Select the relevant measure for this visual under Fields on the right. This example uses “Median Time“
Two new categories will appear on the ribbon:
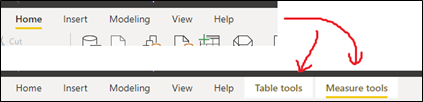
The number of decimal places shown can be edited under “Measure tools” > “Formatting”
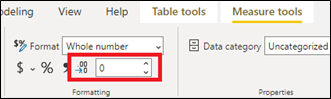
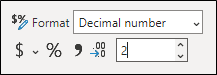
Decimals are shown.
———————————————————————————————
Formatting rows of a table so that it looks like colour heading dividers
- This is achieved by using the conditional formatting tab under the formatting options of your table or matrix. For the sepsis dashboard, this relied on having an index column and was hard coded. The rows that were to be coloured to act as headings word just regular data rows with the heading name instead of data values. These rows also had indexed values, which enables custom row colouring. It is not necessary to explicitly have an index column, as long as there is a column that acts as a primary key for your table (all values unique).